Assessing the performance of a large language model (LLM) can be quite challenging. Traditional performance metrics like F1-score, precision, and recall are not directly applicable, posing a significant challenge for anyone working with LLM evaluation in production.
One major issue is the difficulty in effectively comparing different large language models. Many companies we’ve engaged with resort to human evaluation and manual comparisons. They typically select a set of questions and rely on human evaluators or a team to determine their preference for each model’s answers. While it’s a valid evaluation method, it remains an essentially qualitative experiment, heavily influenced by individual opinions and lacks standardized evaluation metrics.
Additionally, recent research indicates a decline in the performance of well-known OpenAI LLMs over time. You can read more about this in the study titled “Exploring the Impact of Temporal Dynamics on Language Model Evaluation.” This discovery underscores the increased significance of continuously assessing a language model’s performance through robust evaluation systems.
So, how can we approach LLM evaluation in a more objective manner? This blog article will delve into a methodology rooted in mathematical analysis rather than subjective viewpoints. First, we will explore the specifics of the math behind LLM evaluation metrics followed by an evaluation framework for testing LLMs over time.
To compare the performance of two LLMs, or one LLM over time, we are going to use a concept called cosine similarity - one of the key metrics in natural language processing and LLM performance evaluation. Cosine similarity is the cosine of the angle between the vectors; that is, it is the dot product of the vectors divided by the product of their lengths.

In simpler terms, cosine similarity helps us understand how similar two vectors are, making it valuable for semantic similarity analysis. Now, let’s see how this concept assists us in the assessment of LLMs. This is where embeddings come into play once more. If you’ve gone through our previous blog post on in-context learning, you’re familiar with the idea that we can represent any text as a vector by utilizing embeddings - a critical component in machine learning and LLM system evaluation.
By doing so, we can compare two strings (pieces of text) by first using an embedding model to represent both as a vector and then compute the cosine similarity of those vectors. This approach provides a quantitative assessment of LLM outputs against ground truth data.
Now that we know what cosine similarity is and how we can use it for model evaluation, we can look at a real-world example. Let’s compare the model outputs of both GPT-3.5 and MPT-30B against a reference prompt and answer. We ask both language model systems who is the president of the USA and what is his job. Or, more specifically:
Who is the united states president, and what is his job? Answer in no more than two sentences.
We can get a reference answer for this question by creating a two-sentence summary of the definition of the function of the US president by whitehouse.gov.
The President of the United States serves as both the head of state and government, responsible for enforcing laws, leading the military, and conducting foreign diplomacy, with the current President being Joseph R. Biden. The President is elected every four years via the Electoral College, can issue executive orders, and has the power to sign or veto legislation, with a constitutional limit of two four-year terms — Reference answer.
The generated responses of the prompt are as follows for MPT-30B and GPT-3.5.
The president of the United States is the head of state and head of the federal government of the United States. Among the president’s many powers and responsibilities are the ability to make federal law with the help of Congress, to sign or veto legislation, to appoint federal judges and senior federal government officials, to convene and adjourn Congress on occasion, to grant pardons and reprieves to federal prisoners, to oversee the departments of the federal government and to command the U.S. military — MPT-30B answer
As of my last knowledge update in September 2021, the President of the United States is Joseph R. Biden Jr. His job is to serve as the head of state and government, responsible for executing and enforcing federal laws, directing foreign policy, and leading the executive branch of the U.S. government. Please verify this information as it might have changed since then. — GPT-3.5 response.
We can calculate the cosine similarity between our LLM response and the reference answer as follows:
Based on these numbers, we can conclude that both answers are close to the ground truth, but GPT-3.5 outperforms MPT-30B by a small margin in this LLM model evaluation.
We now have a quantitative comparison of MPT-30B and GPT-3.5. However, we should highlight there is one major drawback to this LLM evaluation approach. It requires us to create a set of reference answers and questions which can be time-consuming and hard. But as we will see in the evaluation framework below, we only need to do this once and it enables a powerful measurement tool for evaluating LLMs over time.
By now, we know what cosine similarity is and how we can use it to test the performance of LLMs. Finally, let’s look at how we can apply these principles to monitor the performance of our LLM systems over time using an effective evaluation process.
To evaluate the performance of your LLM, we first need a ground truth source and the associated prompts we are feeding our LLMs to generate a hopefully similar response. How many questions on which topics really depends on your use case, but we recommend you keep the following in mind when creating evaluation datasets.
Ensure your prompts are specific and limiting. For example, limit the maximum number of output sentences. If you are using retrieval augmented generation or in-context learning, ensure you always feed it the same information and limit the LLM’s response to only the data you feed it. Ensure your reference question mimics your real use case as close as possible. For example, there is no value in knowing that an LLM can correctly answer questions about the US president if your use case is answering questions about software engineering for specific tasks. This one seems obvious. But the important part here is that the reference questions need to reflect the work you expect the language model to do for you. Once you have created your testing prompts and the reference answers, build a pipeline that checks these answers using established evaluation metrics. How often you run this evaluation pipeline depends on your specific situation, we recommend you check it at least once a week and preferably every day. The sooner you catch any issues with your LLM’s performance, the sooner you can address them.
An LLM performance evaluation measuring pipeline might look something like this.
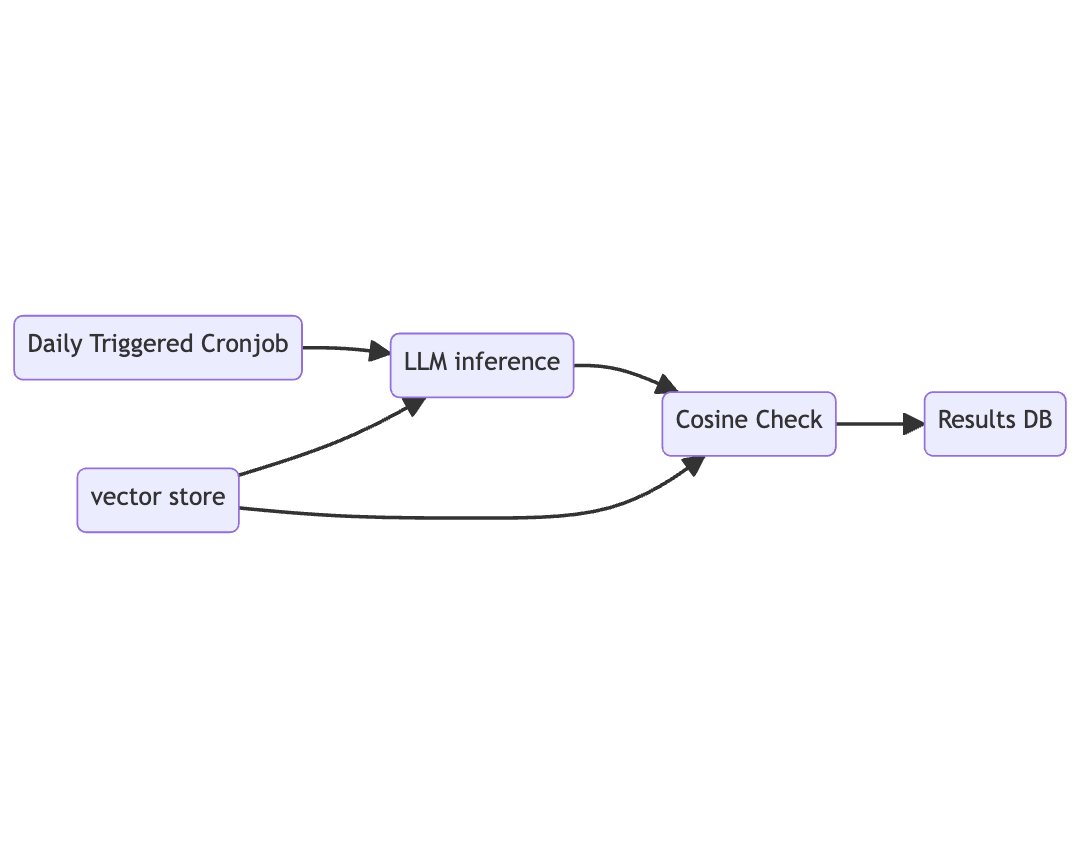
Our pipeline is triggered by a cronjob, on a daily basis and consists of three functions. We store our prompts, reference answers, and their embeddings in a CloudFlare Vectorize store which we add as a resource to the LLM inference function and the cosine check function. In the LLM inference check, we run each prompt through the LLM and pass the answer along to the cosine check function as part of the evaluation process. In the cosine check function, we create vector embeddings of the new inference results and compare them to our reference embeddings stored in the Vectorize index. Results are stored in a SQL store at the end of the pipeline, giving us valuable data for comparative analysis of our LLM benchmarks.
Over time you build up insights on the LLM’s performance in your specific domain. We can build out specific triggers to notify us over Slack, email, or any other tool if the performance of the LLM drops below a certain value; i.e., if my cosine similarity is less than .6, send a notification.
While this is an excellent approach to evaluating an LLM performance over time through automated metrics, we should not overlook the downsides of this evaluation method.
In conclusion, the mathematical comparison of large language models with each other or reference answers can be a powerful tool to use as a quantitative measure of correctness in LLM evaluation. It can help take the human out of the loop (once the reference questions and answers are drafted) and enable automated testing of LLM performance over time through reliable evaluation metrics.
While traditional metrics like precision, recall, and F1-score can be useful in some contexts, LLM evaluation typically requires specialized metrics. Cosine similarity, BLEU (Bilingual Evaluation Understudy), ROUGE (Recall-Oriented Understudy for Gisting Evaluation), and semantic similarity are among the most valuable evaluation metrics depending on the sitaution. However, the right metrics depend on your specific use case and what aspects of performance matter most for your application.
For production systems, regular evaluation is critical. We recommend daily or at least weekly evaluation to catch performance degradation early. This is especially important since research has shown that even well-established models like those from OpenAI can experience performance drift over time. Setting up automated evaluation pipelines makes this process more manageable.
No, a balanced approach that combines automated metrics with human evaluation typically yields the best results. While automated metrics like cosine similarity provide objective, scalable assessment, they may miss nuances in contextual appropriateness or factual accuracy that human evaluators can catch. The most robust evaluation frameworks use a combination of approaches.
Creating high-quality ground truth data is perhaps the most challenging aspect of LLM evaluation. Start by identifying the specific tasks your LLM needs to perform and create reference questions that closely mirror real-world use cases. For answers, consider using expert-crafted responses or consensus-based approaches where multiple experts contribute to the reference answer. While time-consuming, this investment pays off through more accurate evaluation.
Establishing a baseline is crucial. Start by measuring your LLM’s performance using your chosen evaluation metrics, then continue to run the same evaluation tests consistently over time. Track performance trends and set thresholds for alerts. For instance, if cosine similarity drops below a certain threshold compared to your baseline, it may indicate performance degradation that requires investigation.